Other persistence measures
PLSCAN supports five persistence measures for selecting the minimum cluster size threshold:
"size"persistence"distance"persistence"density"persistence"size-distance"bi-persistence"size-density"bi-persistence
[2]:
import numpy as np
import matplotlib.pyplot as plt
from fast_plscan import PLSCAN
from fast_plscan._api import compute_distance_icicles, compute_density_icicles


plt.rcParams["figure.dpi"] = 150
plt.rcParams["figure.figsize"] = (2.75, 0.618 * 2.75)

data = np.load("data/clusterable/sources/clusterable_data.npy")
Size persistence
The default measure ("size") tracks where leaf clusters exist along minimum cluster size thresholds. The leaf tree visualizes these size intervals (persistences) for each leaf cluster on the y-axis:
[3]:
c_size = PLSCAN().fit(data)
c_size.leaf_tree_.plot(leaf_separation=0.1)
plt.show()
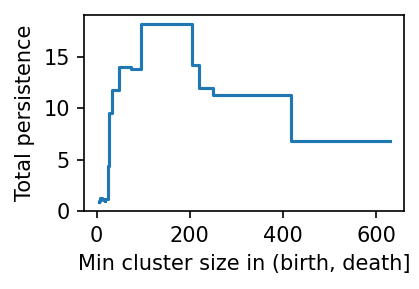
The persistence trace sums the size-persistence contributions of all leaf clusters alive at each minimum cluster size value. Higher total persistence indicates a more robust clustering at that threshold.
[4]:
c_size.persistence_trace_.plot()
plt.show()
Distance persistence
The "distance" persistence measure is similar, but it quantifies the distance range over which leaf clusters exist. These ranges are not directly read from the leaf or condensed tree. A leaf cluster is born at the distance where its descendants first form a connected component with the cluster’s birth-size points.
[5]:
c_dist = PLSCAN(min_samples=10, persistence_measure="distance").fit(data)
c_dist.leaf_tree_.plot(leaf_separation=0.1)
plt.show()
[6]:
c_dist.persistence_trace_.plot()
plt.show()
Density persistence
The same distance ranges can also be expressed in density terms via exp(-distance).
[7]:
c_dens = PLSCAN(min_samples=10, persistence_measure="density").fit(data)
c_dens.leaf_tree_.plot(leaf_separation=0.1, width="density")
plt.show()

[8]:
c_dens.persistence_trace_.plot()
plt.show()
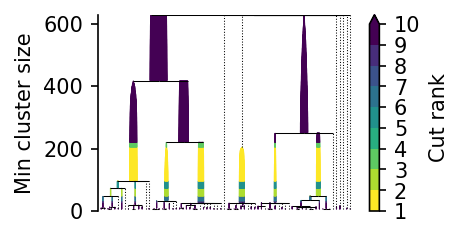
Size–distance bi-persistence
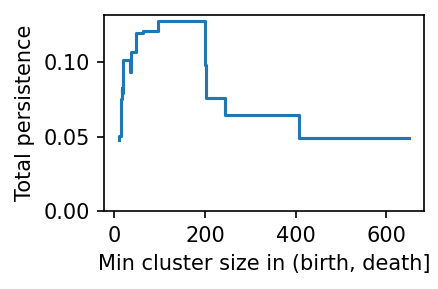
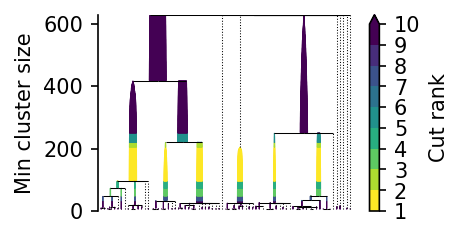
The "size-distance" bi-persistence measure combines size persistence and distance persistence. Leaf clusters with low distance persistence receive lower bi-persistence scores. In this example, clusters below size 100 therefore have lower relative total persistence and lower cut ranks in the plots below:
[9]:
c_sdist = PLSCAN(persistence_measure="size-distance").fit(data)
c_sdist.leaf_tree_.plot(leaf_separation=0.1, width="distance")
plt.show()

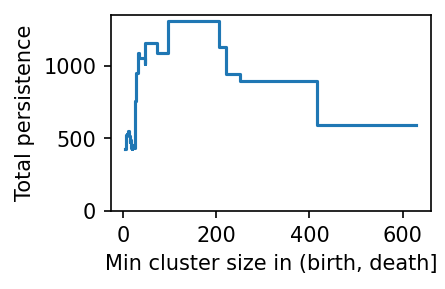
[10]:
c_sdist.persistence_trace_.plot()
plt.show()

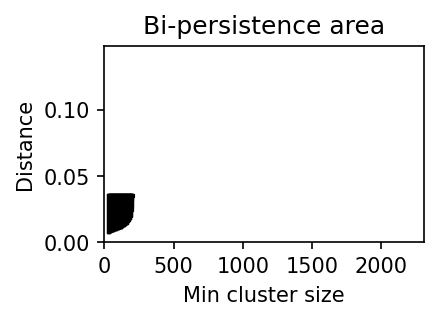
The bi-persistence value can be interpreted as an area in (min_cluster_size, distance) space where a leaf cluster exists. For example, leaf cluster 18 occupies the highlighted area:
[35]:
leaf_idx = 18
max_dist = c_sdist._leaf_tree.max_distance[leaf_idx]
size_trace, pers_trace = compute_distance_icicles(
    c_sdist._leaf_tree, c_sdist._condensed_tree, data.shape[0]
)
for size, pers in zip(size_trace[leaf_idx], pers_trace[leaf_idx]):
    plt.plot([size, size], [max_dist - pers, max_dist], "k-")
plt.xlim(0, data.shape[0])
plt.ylim(0, c_sdist._leaf_tree.max_distance[0])
plt.xlabel("Min cluster size")
plt.ylabel("Distance")
plt.title("Bi-persistence area")
plt.show()
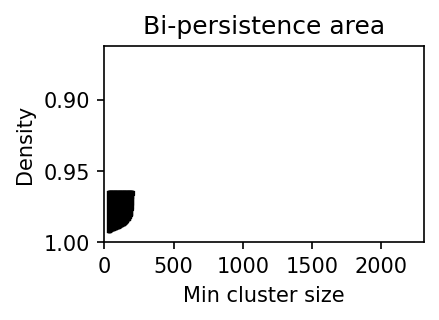
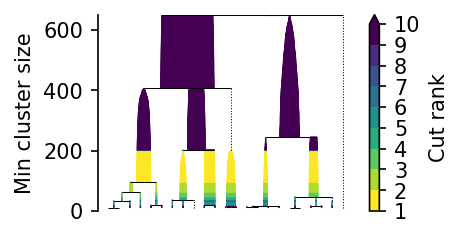
Size–density bi-persistence
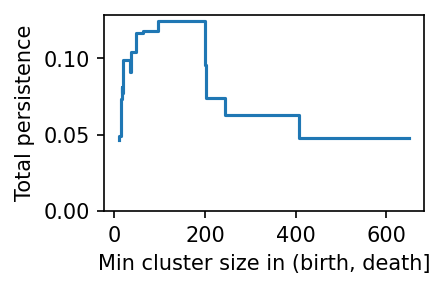
The same bi-persistence idea can be expressed in density coordinates. hdbscan uses 1 / distance as a density transform, while fast-plscan uses exp(-distance) to avoid division by zero. Both transforms map large distances to near-zero density values, so large-distance segments contribute less to total persistence. (For this dataset, the difference between "size-distance" and "size-density" is small.)
[37]:
c_sdens = PLSCAN(persistence_measure="size-density").fit(data)
c_sdens.leaf_tree_.plot(leaf_separation=0.1, width="density")
plt.show()
[38]:
c_sdens.persistence_trace_.plot()
plt.show()
[39]:
max_dist = np.exp(-c_sdens._leaf_tree.max_distance[leaf_idx])
size_trace, pers_trace = compute_density_icicles(
    c_sdens._leaf_tree, c_sdens._condensed_tree, data.shape[0]
)
for size, pers in zip(size_trace[leaf_idx], pers_trace[leaf_idx]):
    plt.plot([size, size], [max_dist + pers, max_dist], "k-")
plt.xlim(0, data.shape[0])
plt.ylim(1, np.exp(-c_sdens._leaf_tree.max_distance[0]))
plt.xlabel("Min cluster size")
plt.ylabel("Density")
plt.title("Bi-persistence area")
plt.show()