Basic usage
For standard workflows, PLSCAN is a drop-in replacement for HDBSCAN*. The estimator API is intentionally similar, so existing code often transfers with only minor changes.
[ ]:
import numpy as np
import matplotlib.pyplot as plt

plt.rcParams["figure.dpi"] = 150
plt.rcParams["figure.figsize"] = (2.75, 0.618 * 2.75)

data = np.load("data/clusterable/sources/clusterable_data.npy")
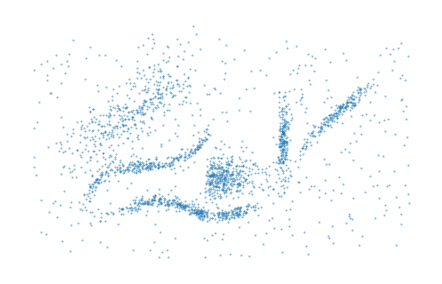
Before we do any clustering lets plot the data so we can see what we are trying to cluster:
[ ]:
plt.scatter(*data.T, s=1, alpha=0.5, linewidth=0)
plt.subplots_adjust(left=0, right=1, top=1, bottom=0)
plt.axis("off")
plt.show()
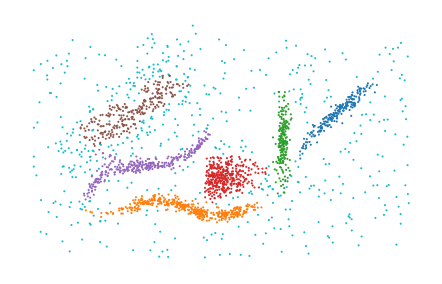
You can generally call PLSCAN in place of HDBSCAN. The key difference is that PLSCAN automatically selects the minimum cluster size threshold by maximizing total leaf cluster persistence, so manual tuning of that threshold is often unnecessary for a strong baseline clustering.
[ ]:
from fast_plscan import PLSCAN

labels = PLSCAN().fit_predict(data)

plt.scatter(*data.T, c=labels % 10, s=1, linewidth=0, cmap="tab10")
plt.axis("off")
plt.subplots_adjust(left=0, right=1, top=1, bottom=0)
plt.show()
And that’s all there is to it in terms of getting started with PLSCAN.